Mining promises few guarantees, but a reduced ore yield is a certainty if errors are made at any stage of the complex, multi-layered drill and blast process. The potential for wasted energy, time, and opportunity costs business more now in an age of declining grades when miners are digging more earth for less ore.
Energy usage increases at each stage of comminution– blasting, excavation, crushing, transport and grinding –and accounts for a significant portion of mining operational costs. Efforts targeted at optimising the blasting process can pay huge dividends downstream, reducing costs and energy consumption.
Hexagon new split colour feature improves fragmentation analysis
Given its associated costs, comminution is increasingly scrutinised by cost controllers, CEOs and investors intent on improving productivity. Technology companies have also focused attention on optimising comminution’s related steps.1
Blasting is the first and lowest cost-per-tonne stage in the comminution value chain. The basic principle that effective blast design can optimise fragmentation from the run of mine (ROM) ore muck pile to improve productivity through digging, loading and crushing to grinding and increase mine site profits is well documented.
Benefits of controlling fragmentation in the blast include reduced wear on equipment, faster loading, and increased truck loads. Detecting oversize rocks at the muck pile can reduce the frequency of a blocked primary crusher.
A second basic principle is a measure of the particle size distribution (PSD) at each unit operation in the comminution cycle allows engineers to manage blast design more optimally. They can produce fragmentation in the ROM ore most suitable to optimise downstream unit processes, to improve mine site productivity and profits.
This article will show how real-time fragmentation analysis at the muck pile can be an important parameter to optimise energy factors for each blast.
Effective blasting: measuring to improve
Engineers, scientists, builders and even philosophers have long promoted the phrase ‘measure to manage’; the essence being if it is not measured, it cannot be improved. Blast engineers measure fragmentation in ROM ore for feedback to manage energy input in the design of blast patterns to optimise the ROM product size for downstream operations, whether they be for ROM leach or feed into the primary crusher.
Many authors have reported:
- For mines with semi-autogenous grinding (SAG) mills, increasing fines in ROM ore can increase SAG mill throughput from 8 – 30%.2
- In iron ore mines, reducing fines in ROM ore can increase the lump to fines product ratio.3
- In heap or dump leach operations, target fragmentation is critical to maintain leach pad permeability and maximise leach recoveries.
Improved fragmentation in ROM ore can increase shovel dig rates and truck fill factors, which leads to decreased cycle times as well as reducing maintenance costs on loading and hauling equipment.
Detecting oversize rocks at the ROM muck pile allows diversion to a secondary breakage area to avoid blocking the primary crusher, which causes downtime and lost production. It would be better to modify the blast design to avoid producing oversize rocks.
As mining companies apply innovative technologies throughout their operations, a measure of fragmentation at the blast is critical to managing advanced fragmentation, differential blasting of ore and waste and grade engineering studies.
Continuous, automatic fragmentation monitoring and measurement
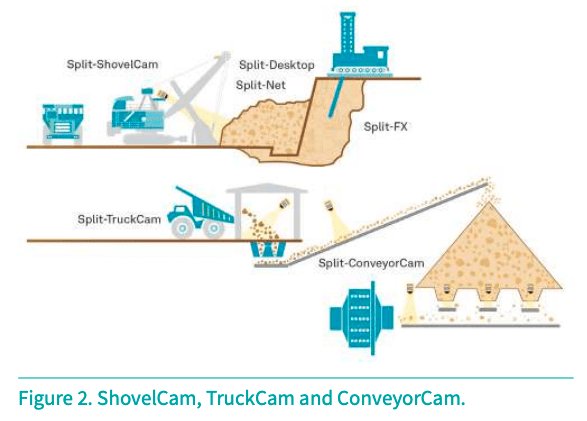
Split Engineering is part of the mining division within Hexagon, a software, sensor, and autonomous solutions’ company. The company’s ConveyorCam systems are designed to measure the PSD of rocks on conveyors from the primary crusher to the SAG mill.
The system automatically measures fragmentation from shovels and excavators working for the ROM muck pile. It provides continuous, automatic monitoring and particle size measurement of blast fragmentation. Unique image analysis algorithms are applied during shovel operation so that quality measurements of post-blast fragmentation are calculated.
The automated process avoids costly manual capturing and editing of images to provide operators with statistically relevant samples for best decision making. Measured fragmentation data is tied to shovel location for comparison to blast design forecasts for overall effectiveness.
The system provides immediate feedback to the mine on blast performance, feed-forward to the plant or leach pad on what is coming from the mine, correlation of PSD to shovel maintenance and enhanced process control decisions.
Mine-to-mill and other available technologies are again in favour as companies are driven to restore productivity, mine site profits and return on capital invested. By measuring PSD online from the mine through to the mill, Hexagon’s ShovelCam, TruckCam and ConveyorCam are among available technologies currently in demand.
Blast design
Effective blast design includes an understanding of:
- Rock structure and rock mechanics where unconfined compressive strength (UCS) and point load index data are complemented by knowledge and measurement of fracture zones
- The blast hole crushing zone is a function of hole diameter and explosive energy.
- Detonation timing and sequencing.
- Production tonnage.
- Downstream process requirements.
Fragmentation models in blast design and simulation software predict PSD of the blast for different rock masses, blast hole geometry and explosive parameters.
These predicted size distributions are used as inputs in simulation of downstream processes to determine the optimum blast design required to increase productivity.
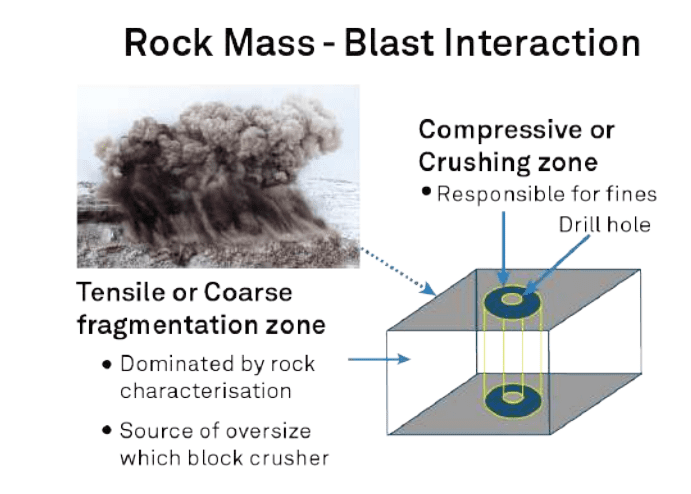
Measurement of actual PSD with ShovelCam or TruckCam allows for development, validation and continuous improvement of the fragmentation models. When a blast hole is detonated rock breakage occurs in two different stress regions, compressive and
tensile:
Compressive stress waves form a ‘crushed zone’ adjacent to the blast hole to create fine particles.
Tensile stress waves propagate the ‘cracked zone’, outside the crush zone and between blast holes to create the coarse particles (Figure 1).
Two fragmentation models used extensively around the world are Kuz-Ram and Swebrec.4,5 Even though both models date back decades, no realistic successors have appeared. Overall:
- The widely used Kuz-Ram model does not recognise the two blast stress regions.
- Experience has shown Kuz-Ram predicts the coarse end reasonably accurately but can underestimate fines generated, however, Kuz-Ram is easy to understand and manipulate.
- The Swebrec model is more complex but is considered to be a better predictor of PSD.
When blast engineers find the actual measure of fragmentation does not match the predicted, they can modify their blast designs to manage selected parameters in the model to meet the target PSD.
Typically, rock mass properties in an ore domain are consistent. Therefore, the blast engineer’s options are to manage blast hole geometry and explosive type and quantity. In the short term, it can be almost impossible to change hole diameter and bench height, due to the investment in drilling equipment and explosive supply. This leaves hole depth, burden, spacing and explosive quantity and position within the hole as variables in blast design, which have proved to provide adequate flexibility.6
Measuring fragmentation
In the early to mid-1990s, Split Engineering developed technology and algorithms to measure online PSD at every stage from the mine to the mill: Split-Online.7 JKMRC found this to be a key tool in developing mine-to-mill strategies and validated the accuracy of the technology.8 The technology was first installed above conveyor belts and at the primary crusher truck dump pocket (Figure 2).
Measuring fragmentation after the blast
As global mining companies adopted mine-to-mill/pit-to-plant strategies to manage fragmentation in the blast to optimise downstream unit operations, the measure of fragmentation in the ROM muck-pile became more significant.
Split-Desktop, the offline, desktop version of Split-Online, was used widely to measure fragmentation in muck-piles on a batch basis.
However, limitations were associated with the infrequent availability of measured data:
- Mine safety procedures restrict technicians’ access to the face of the ROM muck-pile.
- There can be variability and bias of PSD in the muck-pile where coarse particles tend to concentrate at the surface as there is less energy at the top of the blast hole due to the presence of stemming.
- Drones can increase the frequency of taking images, which in turn increases the ‘sample’ size, but currently, it is a manual exercise to acquire and process data sets to generate PSD information.

There is a preference for continuous monitoring of fragmentation in the ROM ore muck-pile, which increases the number of PSD data points, reduces measurement bias and ties the PSD of the blasted product to the blast design at the same location.
This preference led first to the application of Split-ShovelCam systems on rope shovels and excavators in face shovel configuration, then to the development and installation of TruckCam at the primary crusher dump pocket (Figure 3).
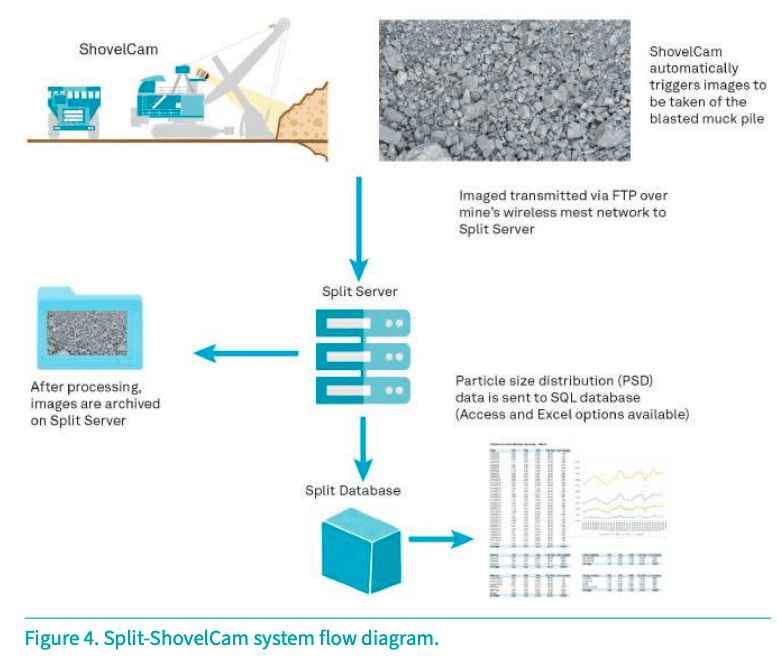
To capture post-blast fragmentation at the source location and at the time of loading, ShovelCam utilises a camera system mounted to the shovels or excavators.
Innovative image algorithms monitor the equipment cycles to effectively capture quality images of the muck-pile face. Images can be linked to the shovel’s global positioning system (GPS) to record the location for further comparison with blast design and integration to fleet management systems (FMS).
The software applies algorithms to process images for particle size and shape and effectively organises data so operators can immediately evaluate effectiveness. This approach allows reliable data to be received through a fully automated system. Therefore, blast engineers can use their time more efficiently and receive the metrics they need to measure, manage, improve blast fragmentation to meet mine product quality requirements.
Calibration of ShovelCam and TruckCam varies from ConveyorCam where a ‘belt cut’ sample is shovelled off the conveyor belt, sieved and the results compared to laboratory sieve analysis. For ShovelCam and TruckCam, the procedure uses Split-Desktop to compare the automated delineations and results to that performed semi-manually with Desktop (Figure 4).
Case studies
Business cases for measuring PSD at the shovel and truck dump locations can include:
n Preventing oversized rocks from entering the primary crusher to decrease the number of bridging incidents and hence downtime of the crusher.
n Providing feedback to blast design engineers as part of an overall mine-to-mill optimisation plan; finer material from blasting reduces the specific energy in comminution and increases grinding circuit throughput.
n Increasing shovel or loader digability and truck fill factors.
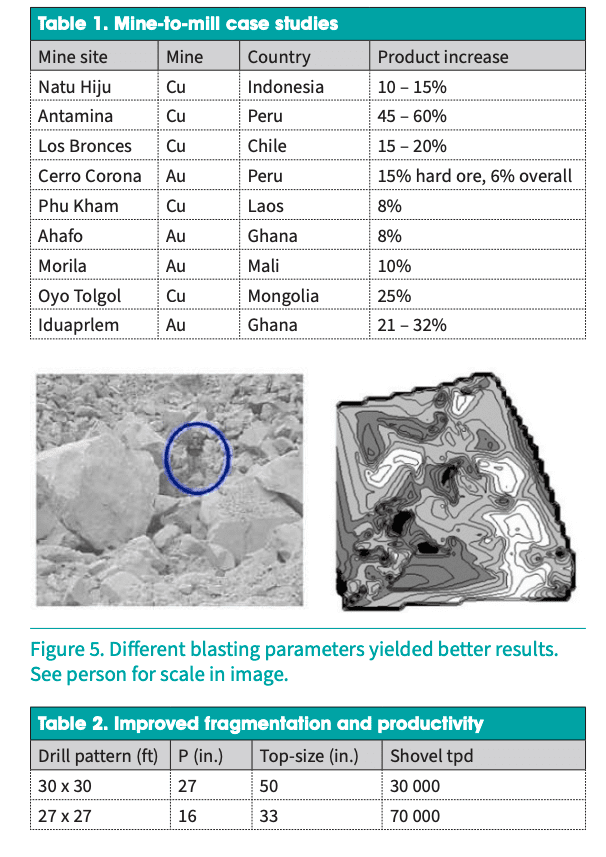
From installations of automated image analysis systems, the following sample of case studies outlines how some mines measure PSD at the ROM muck pile to manage blast design to improve mine site productivity (Table 1).
African gold mine
One TruckCam is located on each side of the dump pocket to catch an image of the ore as it is dumped into the primary crusher. Using the information on the origin of each truck as captured by their fleet management system, PSD measurements are linked back to specific areas in the pit and then to the blast design. Coarser material may be an indication of harder material in the pit which will prompt a change in blast design.
Morenci Copper Mine, Arizona, US
Data from ShovelCam was used to increase the fragmentation of the blast by tightening the drill pattern. Top size in the ROM ore muck-pile reduced from 1.2 m to 800 mm while 80% passing size (P80) reduced from 700 mm to 400 mm.
In addition to improving productivity in the downstream value chain, a significant side-benefit included an increase in shovel digability with shovel productivity rising from 30 000 tpd to 70 000 tpd.9
The previous practice used the same blasting parameters for all rock types, expecting similar results. After a year of data analysis of measured fragmentation over all rock types and mining areas, the site employed a zone-specific blast fragmentation optimisation programme to identify a target PSD to optimise the next stage in the process, either heap leach (for oxide ore) or feed to the mill (for sulfide ore).
Once targets were identified Morenci measured fragmentation to manage fragmentation in the blast to further improve its productivity (Figure 5 and Table 2).
Conclusion
Energy-efficient comminution has been prioritised for all mining companies to maximise existing assets.
Success in improving energy efficiency and productivity requires an effective online measure of PSD from the blast across the entire comminution chain. As a result, the various multi-discipline engineers at the mine site can manage blast design to optimise fragmentation for all downstream unit operations and improve mine productivity.
This is not a development project or a wish for the future. Several innovative technologies are already available to assist operations to improve performance.
Read more Mining Safety News
References
- CEEC, ‘Comminution Energy Factsheet, Coalition for Energy Efficient Comminution’, (2016), www.ceecthefuture.org/resources/smartblasting
- CAMERON, P., DRINKWATER, D., and PEASE, J., The ABC of Mine-to-Mill and metal price cycles (online), AusIMM Bulletin, (2017) www.ausimmbulletin.com/feature/mill-operations-theabc-of-mineto-mill-and-metal-price-cycles/
- MCKEE, D., Understanding Mine-to-Mill published by CRC ORE, (2013).
- CUNNINGHAM, C. V. B., The Kuz-Ram fragmentation model – 20 years on. Brighton Conference Proceedings 2005, European Federation of Explosives Engineers, (2005).
- OUCHTERLONY, F., The Swebrec© function: linking fragmentation by blasting and crushing. Mining Technology (Trans. Inst. Min. Metall. A) (March 2005), Vol. 114 A29
- KONYA, A., and KONYA, C., Six Sigma Blasting to Improve Downstream Operations, Engineering and Mining Journal, (April 2018), pp. 46 – 50
- BOBO, T., and WEBB, P., Shovel-based Fragmentation Analysis of ROM to Improve Blast Planning, EMJ Haulage and Loading Symposium, Phoenix AZ, (2017).
- VALERY Jnr., W., KOJOVIC, T., TAPIA-VERGARA, F.. and MORRELL, S. Optimisation of blasting and sag mill feed size by application of online size analysis. IRR Crushing and Grinding Conference, Perth, Western Australia, (1999).
- LOWERY, M., KEMENY, J., and GIRDNER, K., ‘Advances in blasting practices through the accurate quantification of blast fragmentation,’ SME Annual Meeting, Salt Lake City, Utah, USA, (2000).


Add Comment