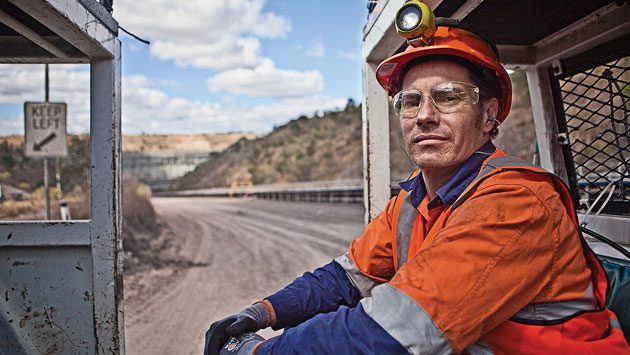
In a sunburnt country like Australia, the consequences of heat stress on a mine site can be catastrophic. Veronica Miller and Dr Graham Bates from Curtin University conducted a study that found the majority of workers on mine sites in Australia’s north-west were inadequately hydrated.
A recently announced expansion of mining operations in the tropical north of Australia means that, over the next few years, the number of outdoor workers in this area will increase significantly. The high ambient temperatures and high radiant heat load experienced in this region for much of the year contribute to physiological heat stress, which increases worker vulnerability to heat illness and to impaired physical and cognitive performance — impacting on both productivity and safety.
Staffing of most remote area installations on a fly-in, fly-out basis means that workers are away from home and may be working up to 12-hour shifts in a thermally stressful environment for as long as 21 days without a break. In this situation, maintaining adequate hydration levels is essential to minimise the risk of heat illness and to avoid excessive fatigue, particularly if the work is physically demanding.
Previous studies in underground mine workers found that few workers were adequately hydrated, a proportion were dangerously hypohydrated at the start of the shift, and this situation tended not to change over the course of the shift. (1,2)
Indications are that the situation is similar for aboveground workers. (3) During prolonged work in the heat, sweat rates of one litre per hour or more are common. Unless this fluid is replaced by drinking, progressive dehydration will result, while in order to improve hydration status, a fluid intake in excess of the loss is required.
EFFECTS OF HYPOHYDRATION
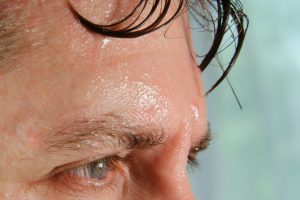
Thirst may not trigger drinking until fluid that is equal to 1–2% of body weight has been lost — at which level, impairment of both physical and cognitive performance is measurable. (4-6) It seems highly likely that this level of hypohydration commonly occurs where workers are exposed to high environmental temperatures for prolonged periods, reducing their productivity and placing them at increased risk of accidents and injuries.
By reducing plasma volume and increasing blood viscosity, hypohydration compromises circulation and physical (especially aerobic) performance, and impairs thermoregulation, thus allowing increases in core body temperature.(7),(8) Adverse effects on cognitive performance appear to be a function of the rate of rise in core temperature which is accelerated by hypohydration.(9) The condition of heat exhaustion results when the circulation is unable to adequately meet the demands of physical work and thermoregulation — both of which require an increased cardiac output. Fatigue, dizziness, headache, nausea and faintness or fainting are common signs of this condition.(10) The long-term effects of chronic hypohydration include an increased incidence of renal calculi and bladder cancer.(11)
In thermally stressful conditions, the effects of hypohydration are additive to the effects of environmental heat stress. A program to monitor and improve the hydration status of workers is an essential part of a comprehensive working in heat policy which has been shown to be instrumental in reducing the incidence of heat illness.(12)
The 2013 study was conducted over two summers at aboveground mine sites and mine-related facilities in the Pilbara region of Western Australia, with the aim of assessing the hydration status of representative groups of outdoor workers. During the second summer, fluid intake was recorded and the rates of fluid loss of subgroups of workers were calculated in order to establish appropriate recommendations for fluid replacement under the environmental conditions of this region.
“…over 70% of the urine samples measured in this study showed inadequate hydration levels…”

Notes: Data are mean and standard deviation; n = number of urine samples. This table contains data on samples collected from a number of subjects over two or three days. “Overall” is the mean for all samples at that site.

Notes: Data are mean and standard deviation; n = number of urine samples. This table contains data on samples collected from a number of subjects over two or three days. “Overall” is the mean for all samples at that site.
Method
Environmental conditions were monitored using a heat stress meter recording air temperature (dry bulb), humidity, radiant heat and wind speed. From these parameters, the wet bulb globe temperature (WBGT) and thermal work limit (TWL) or limiting metabolic rate were calculated.(13) Conditions were either monitored continuously (data logged) throughout the shift or were recorded at the beginning, middle and end of the shift. Participants were recruited on a voluntary basis at all sites using posters, emails and direct approach. Most subjects were followed over two or three consecutive working days. Both coastal and inland locations were included in the study. Protocols were approved by the Curtin University Ethics Committee.
The hydration status of all participants was assessed at the beginning, middle and end of the shift from urine specific gravity (SG) using a hand-held refractometer (ATAGO®). Urine SG has been widely adopted in the underground mining industry as a convenient and reasonably reliable index of hydration status. Workers can be taught to monitor their own hydration levels by observing the colour of their urine, which correlates with the SG.
An SG of less than 1.015 indicates that a subject is well hydrated, but values above this indicate varying degrees of hypohydration (with a value above 1.030 representing a clinical state of severe dehydration).(10)
Fluid intake was assessed by recording the contents of each subject’s drink container at the beginning and end of a shift. Subjects were asked to note the number of any refills and any other beverages consumed during the shift. Fluid loss was assessed by weight difference.
Subjects were asked to bring a light change of clothing (“weighing clothes”). Before starting work, they were weighed in this clothing on an electronic balance (± 50 g); they then changed into their work clothing. At the end of the shift, they were again weighed in their weighing clothes. All fluid intake during the day was recorded and food intake was weighed. Urinary fluid loss was determined by collecting and measuring all urine voided between weighings. Any faecal losses were determined by “before and after” weighing (without changing clothing). From this information, the average hourly fluid loss (which includes both sweat loss and evaporative loss from respiration) was determined.
The fluid loss study was carried out over three consecutive days for each subject, with the average hourly rate of loss being calculated for each day.
RESULTS
The urine SGs that were recorded pre-, mid- and post-shift over the two collection periods are summarised in Tables 1 and 2. Values are mean and standard deviation, and the number of samples included in each set are given. The distribution of urine SGs for each study period is presented graphically in Figures 1 and 2.
The authors recognise the following categories of hydration status (based on urine SG):
- <= 1.015: optimal level of hydration (euhydrated);
- 1.016–1.020: marginally adequate hydration;
- 1.021–1.025: hypohydrated;
- 1.026–1.030: severely hypohydrated, at increased risk of heat illness and impaired performance. Should not work in hot conditions; and
- > 1.030: a clinically dehydrated state, based on the criterion used by the Australian Pathology Association.
On this basis, over 70% of the urine samples measured in this study showed inadequate hydration levels, with nearly 50% indicating that the subjects could be considered as insufficiently hydrated for working in hot conditions (including a significant proportion in the clinically dehydrated category).

“Workers can be taught to monitor their own hydration levels by observing the colour of their urine…”
Table 3 presents the fluid balance data for three groups of workers. Fluid intakes were estimated for all subjects who participated in the study, while weight change and urine output were measured only for those who participated in the sweat loss study.
Sweat rates (rate of fluid loss) are the mean and standard deviation of the average hourly rates calculated for individual subjects each day.

Notes: “Fluid intake over shift” includes data from all subjects in each group. Remaining data are from subgroups that participated in the sweat loss study. Hourly fluid intake and sweat loss are averaged over the shift. All data are mean ± SD for all “persondays” included in the group.

Notes: Data are minima and maxima from readings taken at the beginning, middle and end of the shift.
* Only one reading taken at this site.

Legend
DB: dry bulb temperature
RH: relative humidity
WB: wet bulb temperature
WS: wind speed
Globe: globe temperature (averaged from data that were logged every 15 minutes)
WBGT: wet bulb globe temperature (calculated from average values for environmental parameters)
TWL: thermal work limit (average of values calculated for each logged data point).
Tables 4 and 5 present environmental data that were gathered over the two study periods. Table 4 shows minimum and maximum values from data collected at representative locations pre-, mid- and post-shift.
Table 5 shows the average values from data that were logged every 15 minutes from about 10.00 am to 4.00 pm each day. Due to the sensitivity of the instrument to prolonged exposure to radiant heat, datalogging took place largely in the shade.
Outdoor workers in unshaded conditions were exposed to higher levels of radiant heat than is indicated by these data. Although there is considerable individual variation, the urine SGs generally indicate poor to marginal levels of hydration. A striking feature of the data is the similarity across most groups of the average urine SG and the stability of this parameter throughout the shift. Very similar findings were reported by Brake and Bates for underground miners.2
The lower average SGs for groups C and H are a reflection of the presence in each group of a small number of very well-hydrated individuals; however, the hydration levels of others in these groups are comparable with other groups. Few data were obtained at site 4, but the indication is that the workers at this site were, on average, in a state of clinical dehydration. As the environmental conditions at this site were some of the most severe that were recorded, this finding is of concern.
The relative constancy of urine SGs across most of the data suggests that this correlates with a physiological “set point”, and that this may reflect the hydration level that is maintained by thirstdriven drinking in the absence of a conscious or learned modification of drinking behaviour.
Sweat rates varied considerably between the groups in the fluid balance study. The highest sweat rates were observed in the construction crew (group H), reflecting a generally higher level of work intensity and a more consistent exposure to environmental heat load than the other two groups. This group was mostly well informed and conscious of the need to maintain adequate hydration, and was the only group for which the average fluid intake matched the average sweat rate. Failure to adequately replace fluid losses was reflected in an average net weight loss for the other two groups, suggesting that there is a general decline in hydration levels over the course of the shift. The diuretic effect of caffeinated beverages that were consumed before and during the shift may not only be contributing to this reduction in hydration levels in some cases, but also masking it when assessed by urine SG. To improve hydration status, a conscious effort needs to be made to drink fluids at a faster rate than they are being lost through sweating and other means, and this is difficult where mean sweat rates are over one litre per hour. The ability to increase hydration levels in this situation may be limited by the maximum rate of fluid absorption (. 1.5 L/hr) and, under these circumstances, a rehydration fluid that is formulated for rapid absorption and fluid retention may play a useful role. Such a fluid needs to be formulated for industrial rather than sporting use, and needs to be suitable for consumption in large volumes over prolonged periods.
Individuals who start work in a well-hydrated state appear to protect this status, with urine SGs remaining low throughout the shift. As hypohydration places individuals at an increased risk of developing heat-related illnesses (particularly if the work rate increases (increasing heat production) or environmental conditions become more severe (impairing heat loss)), education needs to bedirected not only towards replacing fluids that are lost during the shift with appropriate beverages, but also to improving the level of hydration at the start of the shift.

Environmental conditions were similar over the two periods, with coastal dry bulb temperatures in the mid- to high-30s with 50–60% humidity. Inland conditions were hotter but humidity was lower. Wet bulb globe temperature readings in excess of 30ºC were common in all locations — precluding work in all of these situations if this industry standard is applied rigorously. Recent research has shown the WBGT to be an excessively conservative index, with the TWL index providing a more reliable indication of thermal stress.(14) A TWL of over 220 W/m2 predicts no thermal limitation to work where workers are self-pacing and adequately hydrated; values of between 140 and 220 W/m2 indicate that hydrated, acclimatised individuals may safely perform unrestricted light to moderate work. Even on the hottest days, the wind speed (air movement) at all sites was sufficient to keep the TWL above 140 W/m2 and, for the most part, above 220 W/m2.
However, this is not always the case. In many work situations in many parts of Australia, high ambient and/or radiant temperatures are combined with a lack of air movement and/or a high level of humidity to create conditions of high thermal stress, where the ability to dissipate body heat efficiently is critical to the ability of workers to function safely. In this context, the finding that the majority of workers in these hot outdoor environments are inadequately hydrated to work in hot environments is of concern, as poor hydration erodes their margin of safety.
Declining levels of hydration over the course of a shift undoubtedly contributes to fatigue and the risk of accidents — as well as the possibility of heat illness.
The pattern of fluid intake is, to a large extent, habitual, and therefore is susceptible to modification. The creation of a culture of hydration awareness among the workforce is an important component of a risk management strategy for workers who are exposed to a thermally stressful environment.
RECOMMENDATIONS & CONCLUSION
The following recommendations are suggested for work that is undertaken in hot conditions:
- Workers should be educated on the importance of adequate hydration and suitable beverages for fluid replacement. This advice should be reinforced prior to the onset of hot weather.
- Workers should be taught to monitor their own hydration status, either by using urine test strips for SG (which should be made available) or from urine colour and volume.
- The OHS department should periodically monitor the hydration status of workers (urine SG measurement).
- Cool, palatable water or electrolyte replacement beverages must be available close to the workplace in adequate quantities. The following fluid consumption is recommended:
- manual workers: approximately 1 L/hr of either plain water (supplemented by frequent meal breaks) or industrial rehydration fluid (containing electrolytes and some carbohydrate). As previously noted, sport drinks and non-diet cordials are not suitable for consumption in large volumes.
- machinery operators, etc: 600 mL/hr of water (in addition to food and any other beverages consumed).
- sedentary workers: 400 mL/hr of water (in addition to food and any other beverages consumed).
- food must be consumed at meal breaks in order to replace electrolytes and maintain energy.
- the consumption of caffeinated beverages before and during the work shift should be discouraged (possibly by limiting availability).
- if possible, the environment should be modified, for example, by providing shade or increased ventilation.
ACKNOWLEDGEMENT
This study was supported and financed by Rio Tinto Iron Ore.
REFERENCES
[1] Brake, R. Fluid consumption, sweat rates and hydration status of thermally stressed underground miners and the implications for heat illness and shortened shifts. In the proceedings of the Queensland Mining Industry Safety and Health Conference, Townsville, 2001.
[2] Brake, DJ and Bates, GP. Fluid losses and hydration status of industrial workers under thermal stress working extended shifts. Occup Environ Med 2003, 60(2): 90-96.
[3] Gazey, C, Bates, G and Matthew, B. Fluid loss and replacement in petroleum workers from the north west of Western Australia. J Occup Health Safety – Aust NZ 1996, 12(4): 457-461.
[4] Nadel, E, Mack, G and Takamata, A. Thermoregulation, exercise and thirst: interrelationships in humans. In Gisolfi, C, Lamb, D and Nadel, E (eds). Perspectives in exercise science and sports medicine, vol 6: Exercise, heat and thermoregulation. Dubuque: Brown and Benchmark, 1993, pp 235-256.
[5] Sawka, MN and Pandolf, KB. Effects of body water loss on physiological function and exercise performance. In Gisolfi, C and Lamb, D (eds). Perspectives in exercise science and sports medicine, vol 3: Fluid homeostasis during exercise. Carmel: Cooper Publishing Group, 1990, pp 1-38.
[6] Gopinathan, PM, Pichan, G and Sharma, VM. Role of dehydration in heat stress-induced variations in mental performance. Arch Environ Health 1988, 43(1): 15-17.
[7] Jimenez, C, Melin, B, Koulmann, N, Allevard, A, Launay, J and Savourey, G. Plasma volume changes during and after acute variations of body hydration level in humans. Eur J Appl Physiol Occup Physiol 1999, 80(1): 1-8.
[8] Sawka, MN, Francesconi, RP, Young, AJ and Pandolf, KB. Influence of hydration level and body fluids on exercise performance in the heat. JAMA 1984, 252(9): 1165-1169.
[9] Hancock, PA and Vasmatzidis, I.Effects of heat stress on cognitive performance: the current state of knowledge. Int J Hyperthermia 2003, 19(3): 355-372.
[10] Donoghue, AM, Sinclair, MJ and Bates, GP. Heat exhaustion in a deep underground metalliferous mine. Occup Environ Med 2000, 57(3): 165-174.
[11] Michaud, D et al. Fluid intake and risk of bladder cancer in men. New England Journal of Medicine 1999, 340: 1390- 1397.
[12] Brake, D and Bates, G. Occupational heat illness: an interventional study. In the proceedings of the International Conference on Physiological and Cognitive Performance in Extreme Environments, Canberra, 2000.
[13] Brake, DJ and Bates, GP. Limiting metabolic rate (thermal work limit) as an index of thermal stress. Appl Occup Environ Hyg 2002, 17(3): 176-186.
[14] Bates, G and Miller, V. Empirical validation of a new heat stress index. J Occup Health Safety – Aust NZ 2002, 18(2): 145-153.


Add Comment